The most important task for
my VBC students during the first two-week
sprint was game prototyping. We had six themes in which we worked: geology, biotechnology, collecting/museums,
children making a difference, trains, and dinosaurs/paleontology. Rather than dictate specific targets for each theme, I decided to allow them to explore any themes they like, using their preferences to gauge where they are finding interest and inspiration. The best of these would be subject to analysis by the whole team, and we would choose a small subset of those to move forward into the next sprint.
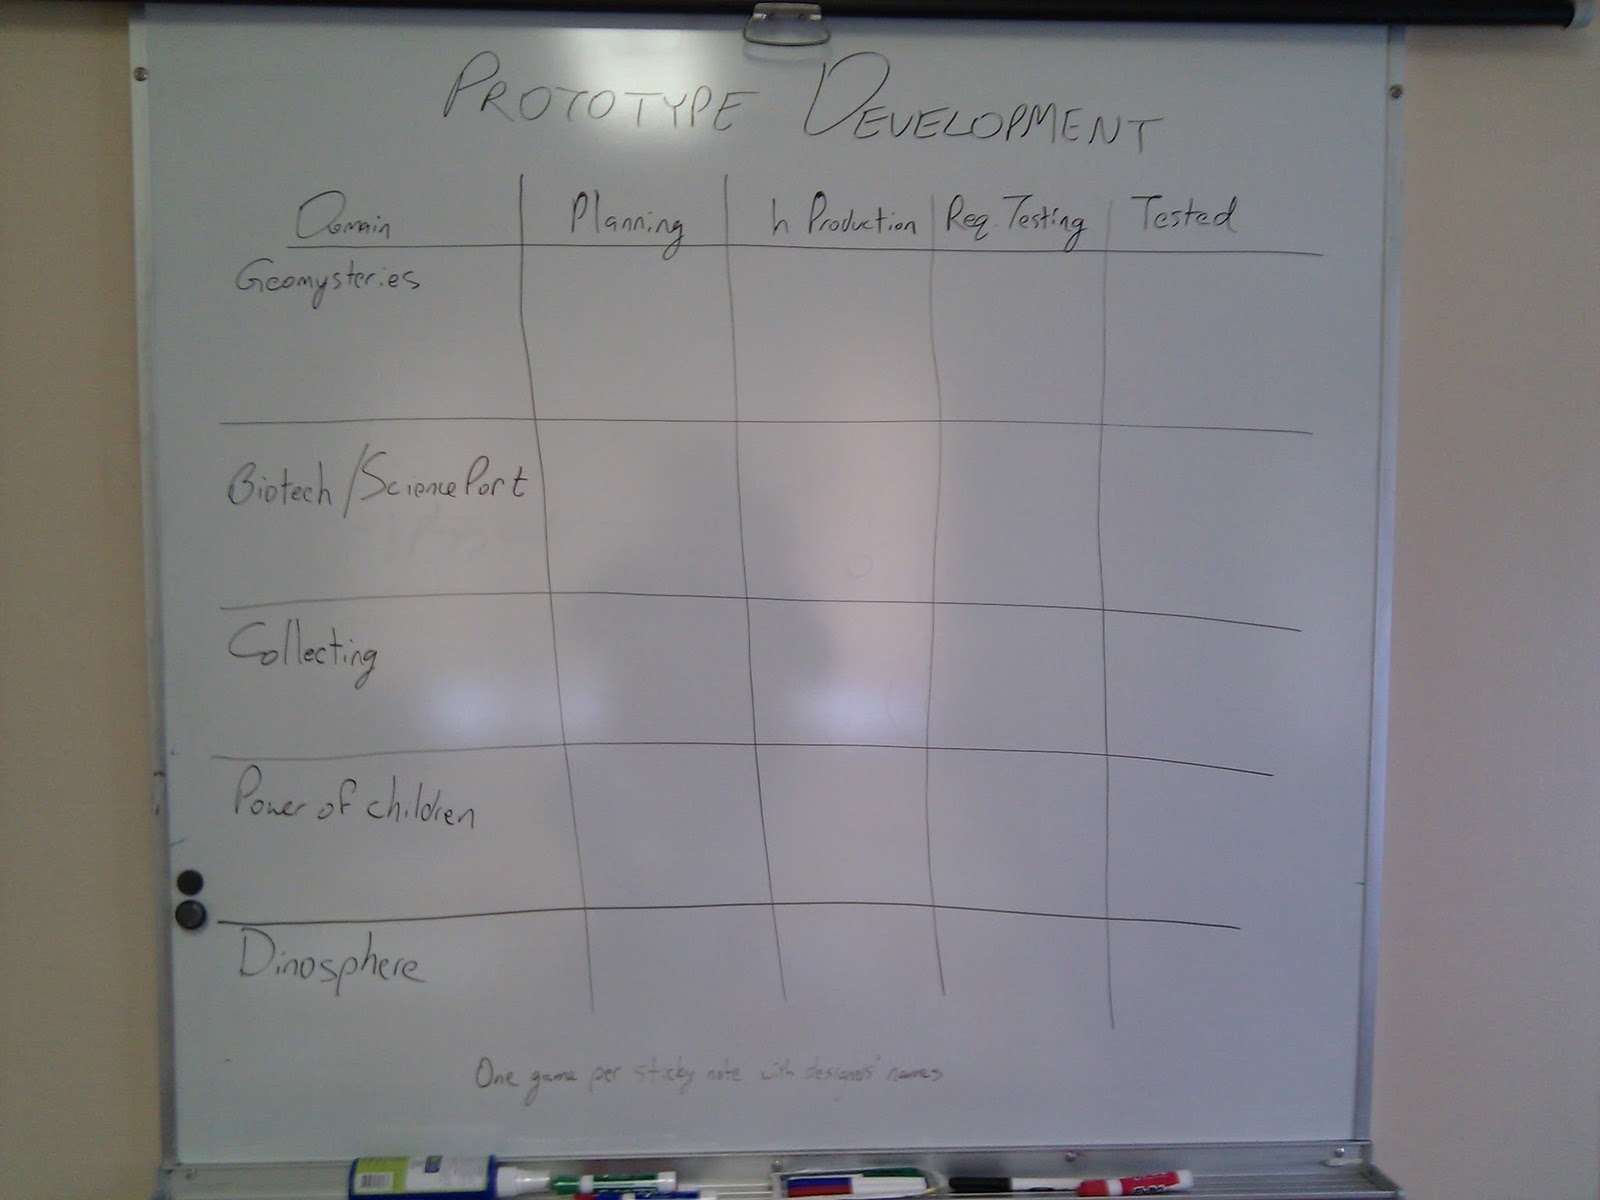
One of the students suggested using a table to track progress, similar to the task board we are using as part of Scrum. Based on this sound advice, I used the day before the start of the sprint to draw the table shown below.
 |
| Prototype Development Board, version 1.0 |
The rows represent the themes, and the columns represent phases of design: planning, production, testing, and done. In this case, "done" meant ready for more careful evaluation by the whole team. The idea was that each student would write his or her name on a sticky note and march it across the board as it is developed. After a few days of prototyping, the board looked like this:
 |
| Prototype Development Board, version 1.1 |
Then the question arose: what to do with a game that, after testing, needed more work? I advised the student to simply move the sticky note to the appropriate column on the left, and that this was an expected part of the process. It hit me like a ton of bricks: the tabular format assumed a left-to-right progression that was wholly incompatible with
a cyclic design process. I yanked all the sticky notes from the board and revised it into the following:
 |
| Prototype Development Board, version 2.0 |
Now, game concepts start in the upper-left
ideate phase and progress clockwise through
build and
playtest. After testing, they either go back into
ideate or, if they are abandoned, they end up in the
graveyard. This presentation clearly captures the cyclic nature of design thinking. Topologically, it's still a table—you could cut it at any of the red lines and spread it into a conventional rows-and-columns approach—but the visualization of the data makes all the difference. Later, we added a
shelf (as in "put it on the shelf") for those concepts that were complete enough for this first pass, those that could be evaluated by the team at the end of the sprint.
 |
| Prototype Development Board, version 2.1 |
At the end of the sprint, the 13 students had created 29 prototypes. We spent the afternoon before the end of the sprint playtesting thirteen candidate prototypes. In this case, a simple tabular view was used to list the games, their creators, the number of players, and whether or not any given student had tested it.
In the
Sprint Review meeting, seven of these were discussed as fitting within our mission and scope. For the record, the discussion of each candidate should have been
timeboxed: sitting in comfortable chairs around a fireplace can get people talking longer than necessary to make a decision. Be that as it may, for the first pass, each student was asked to mark which game was their first choice for moving forward.
With one exception, the students clustered around three ideas. The one outlier consented to abandoning her first choice, and so with just one iteration, we had selected our three to move forward. In the subsequent
Sprint Planning meeting, we rearranged personnel so that each team had a mix of students from Computer Science and Arts & Humanities. As I write this post, we are midway through Sprint 2, and the students have explored many variations on the core mechanics of the three prototypes.

 With one exception, the students clustered around three ideas. The one outlier consented to abandoning her first choice, and so with just one iteration, we had selected our three to move forward. In the subsequent Sprint Planning meeting, we rearranged personnel so that each team had a mix of students from Computer Science and Arts & Humanities. As I write this post, we are midway through Sprint 2, and the students have explored many variations on the core mechanics of the three prototypes.


No comments:
Post a Comment